E-Classroom: SBS Oakland Baseball Simworld Simulation Run
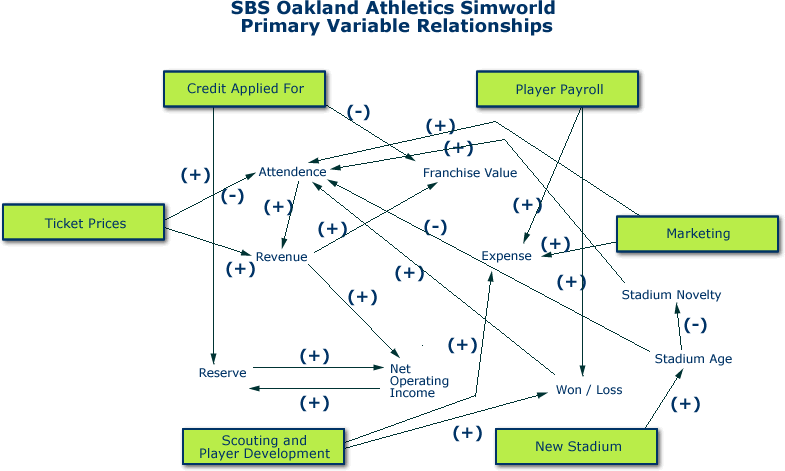
Diagram Legend
(Box shape) = Decision variable
(+) = Decision causes variable to increase or has a positive relationship with
it
(-) = Decision causes variable to decrease or has a negative relationship with
it
(+)(-) = Variable can cause increase or decrease or has an alternating positive
/ negative relationship depending on the condition present
A review of the basic operation of the simulator is presented below, after the
review of your performance, and your entry in "Oakland Baseball Businesss and Operations Insights" below
Share your Oakland Baseball Businesss and Operations Insights with SBS and other students and players. From stadium financing strategies to methods to eliminate debt, click on Oakland Baseball Simworld Forum.
Congratulations: Let's review your performance You posted a
total score of $Values.get('Total_Score'). Let's look at the components of actions
that caused you to achieve this score.
Won-Loss Record
#CustomLineGraph( ['As_team_won_and_loss_record'] 475 320 "0xFFFFFF" false "year" "" 2)
#if($FunctionLibrary.integer($Values.world_series_championships.Result) > 0 )Over the course of the simulation, you built a team that earned $Values.get('world_series_championships').
This success helped to fuel attendance for those years, and merchandise sales for
the next year. Each World Series Championship gains 20 points.#else #end
#if($FunctionLibrary.integer($Values.world_series_championships.Result)> 2 )Over the course of the simulation, you built a team that earned $Values.get('world_series_championships').
This means that you produced an organizational structure that was able to consistently
field competitive teams. This also shows up in the overall value of the franchise,
provided you did not over spend the money you earned.#else #end
#if($FunctionLibrary.integer($Values.playoff_appearance_total.Result) > 0 )Over
the course of the simulation, your firm earned $Values.get('playoff_appearance_total') playoff appearances.
Each playoff appearance gains 8 points.#else #end
#if($FunctionLibrary.integer($Values.playoff_appearance_total.Result)> 4 )Over the course of the simulation, your firm earned $Values.get('playoff_appearance_total') playoff appearances.
Even without the World Series, this is a remarkable achievement and means that you
have built a corporate structure that puts competitive teams on the field.#else #end
Net Operating Income
#if($FunctionLibrary.integer($Values.get('NOI_tally_evaluation').Result) ==3 )
One reason for your good score is that you had more years with a positive Net Operating Income, than with a negative one. Thus, you were
able to build a healthy cash reserve. #else #end
#if($FunctionLibrary.integer($Values.get('NOI_tally_evaluation').Result) ==2 ) One reason for your score is that you had more years
a negative Net Operating Income, than with a positive one. A negative net operating
income cuts into your reserve, reducing it. #else #end
This is what your NOI looks like over the entire simulation run:
#CustomLineGraph( ['annual_As_NOI'] 475 320 "0xFFFFFF" false "year" "" 2)
Franchise Value
#if($FunctionLibrary.integer($Values.get('As_franchise_value').Result) <200000000) Another reason for your score is the total Franchise Value. This is
estimated at roughly 2.2 times total revenue. In this case, you were not able to
significantly increase Franchise Value. #else #end
#if($FunctionLibrary.integer($Values.get('As_franchise_value').Result)>200000000) Another reason for your good score is the total Franchise Value. This
is estimated at roughly 2.2 times total revenue. In this case, you were able to significantly
increase Franchise Value. #else #end
#if($FunctionLibrary.integer($Values.get('As_franchise_value').Result)>300000000) Not only were you able to increase Franchise Value, you were successful
in doubling the value of the organization. This represents an over 100 percent increase
in the value of the team, or about a 6.6 percent increase in Franchise Value, each
year. #else #end
#if($FunctionLibrary.integer($Values.get('As_franchise_value').Result)>400000000) Moreover, the value is greater than $400 million. This represents
a remarkable turnaround in the economic performance of the organization. #else #end
This is what your Franchise Value looks like over the entire simulation run:
#CustomLineGraph( ['As_franchise_value'] 475 320 "0xFFFFFF" false "year" "" 2)
Baseball Organization Economic Structure
Another reason for your score is Economic Structure. In this view, there are three
main expenditures that essentially describe how the team expects to control its environment:
player payroll, scouting and player development, and marketing.
Player Payroll
Player Payroll is simply the total number of dollars your
paying your players. There are low payroll teams, like the
2002 Oakland Baseball, and there are high payroll
teams, most notably the New York Yankees. There are various
reasons for the choice of high medium or low payroll. In
the case of low payroll teams, some (again like
the Baseball) place a high investment in scouting and
player development. This is the farm system. The idea is
that an organization can "grow" players, which
they expect to lose to free agency after a period of
time.
A high payroll team is that because the organization wants to have the best players
and draw the greatest number of fans possible. But to maintain such a level, the
organization's revenue structure must be large enough to allow this. The point here
is that revenue is "driven" by expenditures: the more you want to do in
a certain area, the more money you need to do it.
Maintaining a high payroll is hard for a small-market team. The definition of "small
market" is defined by the radio and television contract, primarily. The Yankees
have a radio and television contract that reaches $60 million annually. That's more
than half of the Baseball 2002 total revenue, and the largest contract in Major
League Baseball. The Baseball are somewhat constrained by being in a two-team market,
where they split regional resources with the Giants. (In fact, from the perspective
of radio and television contracts, the Giants' share is larger.) This is where a
new stadium can help a team like the Baseball reach "high payroll" status.
Borrowing money can also help, but the organization is saddled with debt from borrowing
money.
Once that status is reached, poor attendance due to poor team
performance can make it hard to remain at a high payroll level.
Scouting and Player Development
This expenditure comprises the farm system of the organization.
Here, teams rely on scouts to spot talent worldwide, and build training facilities
for their players and in the minor leagues. The Houston Astros are a great example of
an organization that made the decision to concentrate on scouting and player development
in preparation for the 2003 season.
The World Champion Angles are another example. This
link presents a recent ESPN article on the firm's focus
on player development.
Marketing Expenditures
Marketing is what helps "put butts in seats." The
organization does this by producing an ad campaign, and releasing television, newspaper,
and radio ads. They also have special "tie-ins" with other products, like
airlines, and travel agencies, as one example. There are also special promotional
events and in-stadium events. One example is the now famous "Dot Racing"
game featured at Baseball contests, during the "Haas" era, when the team
was owned by the Haas Family. Then, the marketing director was Andy Dolich, who created
a lot of interesting ways to get people to come to the game.
Dot Racing was one of them. In Dot Racing, fans bet on animate "Dots" "racing"
each other on the Jumbotron screen.
Marketing can be as expansive as the imagination and budget.
In this simulator, its assumed that a budget in the area of $8 million or higher
is such that you are responsible for a percentage of the attendees. What can that
translate to? One example are free gifts, like bobblehead dolls for the frst 10,000
fans. The point is, people have a reason to come to the games beyond the game itself.
A low marketing budget means you are just doing the basics, nothing beyond that.
Stadium
Matters
Let's see what you did regarding the existing stadium, and a new stadium.
Attendance
#CustomLineGraph( ['annual_As_attendance'] 475 320 "0xFFFFFF" false "year" "" 2)
#if($FunctionLibrary.integer($Values.get('attendance_comparison').Result) ==1) You
realized a good run of increases in attendance. This contributes to a good score
and high franchise values. Why? Because this is a representation of the popularity
of the team, and that translates into greater revenue from ticket sales. #else #end
#if($FunctionLibrary.integer($Values.get('attendance_comparison').Result)== 0) One major component of a poor score is constantly falling attendance. In this
case, you had more years where attendance falls than years where attendance increases.
This is due in part to the team's won-loss record. If it's poor no it's harder to
draw patrons. You've got to spend money on marketing. #else #end
Ticket
Prices
This graph shows changes you made in single game ticket prices for both existing and new stadiums.
#CustomLineGraph( ['D_____As_standard__avg_ticket_price_per_game_existing_stadium','D_____As_standard__avg_single_game_ticket_price_new_stadium'] 475 320 "0xFFFFFF" false "year" "" 2)
This graph shows changes you made in season ticket prices for both existing and new stadiums.
#CustomLineGraph( ['D____As_season_ticket_price_existing_stadium','D_____As_season_ticket_price_new_stadium'] 475 320 "0xFFFFFF" false "year" "" 2)
And this graphs shows any variable pricing strategy you used.
#CustomLineGraph(['avg_ticket_price_with_variable_pricing_NS','avg_ticket_price_with_variable_pricing_ES'] 475 325 "0xFFFFFF" false "year" "" 2)
Decision To Build New Stadium? #if($FunctionLibrary.integer($Values.D_____new_stadium_option.Result)==0 ) No #else Yes #end
Urban or Suburban Stadium Location? #if($FunctionLibrary.integer($Values.get('D_____urban_or_suburban_stadium_location').Result)== 0)Suburban location #else Urban location #end
Other Organization Decisions
#if($FunctionLibrary.integer($Values.get('D__relocation_of_team').Result)== 1) You attempted to move the organization #else You did not attempt to relocate the team away from Oakland. #end
#if($FunctionLibrary.integer($Values.get('D__relocation_of_team').Result)== 1)
#if($FunctionLibrary.integer($Values.get('D__relocation_choice').Result)==1)The choice city to move to was Portland #else #end
#if($FunctionLibrary.integer($Values.get('D__relocation_choice').Result)== 0)The choice city to move to was Fremont #else #end
#if($FunctionLibrary.integer($Values.get('D__relocation_choice').Result)== 2)The choice city to move to was Washington DC #else #end
#if($FunctionLibrary.integer($Values.get('D__relocation_choice').Result)== 3)The choice city to move to was Charlotte #else #end
#if($FunctionLibrary.integer($Values.get('D__relocation_choice').Result)== 4)The choice city to move to was Sacramento #else #end
#if($FunctionLibrary.integer($Values.get('D__relocation_choice').Result)== 5)The choice city to move to was Las Vegas #else #end
#else #end
SBS Oakland Baseball Simworld Simulator Operation
Simulation Operation and its Relevance to Real World Business Dynamics
The primary objective of the Oakland Baseball Simworld is to understand the basic
dynamics that drive the business operations of a major league baseball team. The
Oakland Baseball are arguably the most successful "small-market team"
over the last 20 years. Their unique position - sharing a regional market with the
San Francisco 49ers, playing in one of the older stadiums in the league, and competing
with eight different professional sports organizations for the San Francisco Bay
Area sports dollar - presents a great backdrop for study of the business firm that
is the Oakland Baseball Baseball Organization.
While the simulator currently has 80 decision variables (and
will have more in the future), there are really only
six decision variables that truly govern a positive
or negative performance for the organization in each year
of the simulator: Player Payroll, Ticket Prices, Marketing
Expense, Scouting and Player Development Expense, Credit
Applied For, and New Stadium. That's a simplification
of the main decision variables; below we will explore
each one in greater depth.
Player Payroll
This is an expression of the total
payroll of the organization. It starts at $40 million, but you can reduce
it to $35 million or increase it to as high as $140 million.
The general rule here is that the higher the average
payment to each player -- the total of which gives player payroll for that
year -- the more likely it is that your
organization will go to the playoffs and perhaps win
the World Series. Remember, the key word is "likely:" in the
2002 season the success of the teams in the MLB American
League West was in near inverse proportion to the size of their
player playrolls for that year.
The Anaheim Angels, the
eventual World Series Champions, had a payroll of approximately $60 million,
and the Oakland Athletics which won the AL
West, were at even less: $40 million. On the other hand,
the New York Yankees have the highest payroll in pro baseball and have
made it to the World Series four
of the last five years. So while there is evidence of
the correlation between healthy payrolls and winning records, its not a
perfect one. One must be able to adjust their
business strategy should it call for a high payroll organization,
and that expensive group of stars fails to win on the field.
Scouting and Player Development
One primary reason for the success of the players on the field, is the farms system
the organizations have constructed. This is certainly true for the Oakland Athletics,
which boast one of the most successful scouting and player development programs
in the league. It's this part of the organization that's contributed vastly to their
success, and spawned an alternative to the high payroll approach: the high cost scouting
/ low player payroll plan. It is also a key reason for the emergence of the San Francisco
Giants as a competitive organization.
Indeed, the success of the Athletics in this area has not gone without notice
in MLB. In the case of this simulator, there is a two-year lag between increases
in spending in this area, and impact on the teams won/loss percentage. As a warning,
the cost to achieve a measurable impact in this area is quite high, and should be
approached with care.
Credit Applied For
Of all aspects of the business of baseball, debt is one that's least
discussed, however arguably the most important. In
the simulator one can apply for as much as $100 million
in debt. But the terms applied to its repayment are better
for a new stadium than for an existing stadium. In
the case of the Oakland Athletics, the problem is attached
to their operation within the existing short lease structure
and limited revenue-generating capacity of the current
Network Associates Coliseum. It's difficult to obtain
a long-term credit line with a lease that's only five
years in length. By contrast their lease would be as
long as 30 years in a new stadium. From a lender's perspective, that's
a long term revenue stream. The value of a long term
lease can't be underscored. It's the basis for many
long term contracts for naming rights revenue, television
and radio revenue, and other types of sponsorships. Currently,
the Baseball are handicapped by their current situation.
Once "Credit Applied For" is received in the simulator, its placed directly
into the organization's reserve. The user can access as much or as little as needed
annually. The amount drawn goes directly into Net Operating Income. Since part of
your score is based on the maintenance of a healthy Net Operating Income, credit
drawn and placed into the reserve can help you post a good score at the end of a
simulation run. From a business perspective, you can use debt to purchase player
contracts, or even as part of the overall financing package for the construction
of a new stadium. But again, care is required. This is not "free money;" it
comes with a price. And that price is the interest payments on the money
borrowed, or the borrowing costs.
Those expenses are higher in an existing stadium than they would be in a new stadium,
because of the longer lease terms and higher revenue generation common in newer stadiums.
The point is, the credit is money you have to pay back. While their is a debt limit
of $100 million in the simulator, once you go below that maximum, you can borrow
more money. That money counts against overall Franchise Value. In the simulator,
Franchise Value is yet another measure of your score. Thus, you have to find the
balance between the debt required to be successful and the level of overall Franchise
Value that's impacted by your decision to incur debt.
Ticket Prices
Still the primary tool for revenue generation for a baseball organization, regardless
of level -- major league or minor league -- is the increase in ticket prices. That
action will lead to an automatic rise is revenue under the proper circumstances.
For example, a baseball firm with a won/loss record over .600, which has not only
made the playoffs, but won the American League East, yet has an average ticket price
of $11 per game. The semi-annual rise in player salaries causes this organization
to look to ways to generate revenue to both keep their current players and gain new
players.
A healthy economy plus below MLB average ticket prices points to an increase in
ticket prices as one solution. Thus, the team's president approves an increase in
ticket prices by $2 each game. Attendance for the organization's contests does not
decrease; it remains about the same as the year before. This permits the team to
gain revenue to finance its business plan's objectives of higher payrolls and greater
expenditures for marketing. Raising ticket prices can work, if the economy and the
team's on-the-field performance are both good.
Now, let's take the negative example.
The reverse scenario is this: the economy is less than healthy such that baseball
fans can't afford a $2 ticket price increase. The team president approves the ticket
price plan, believing that the popularity of the successful club will overcome economic
recession.
The result is a drop in attendance from the previous year, directly offsetting
any ticket price gains that may have been realized had the economy performed better.
The decrease in fans coming to games occurred even as the ballclub won the American
League East for the second year in a row. Because of the terrific, job-laden economy and the
baseball firm's move to sign star players at premium prices, the organization posted
a loss of $15 million.
Now the team president is faced with a new decision: increase ticket prices in
an effort to recover the loss, or decrease ticket prices to draw back patrons. (Note
that, in this case, the organization's decision maker does not want to reduce the
size of the team's payroll.)
The team's president considers marketing expenditures to be one alternative solution.
Marketing
If you've seen those creative advertisements for baseball teams, they don't come
cheap. A standard advertising campaign, including development, and purchase of ad
space, and other activities, can run several million. An effective marketing plan is a major
investment, but it draws fans. An increase in expenditures translates to such activities
as "bobblehead" dolls for the first 10,000 fans, or roses for every mother
(or want-to-be-mother) for a game on Mother's Day. The objective is to craft initiatives
that draw fans to games which normally don't post large attendance numbers.
Buiilding A New Stadium
Of all of the decisions in the Oakland Baseball Simworld, building a new stadium
is the most difficult and complex undertaking. The "help" section discusses
the difference between the Basic and Advanced Decision levels when you are considering
the construction of a new stadium. Here, we will focus on the process of building
a new baseball structure and its importance in the overall fiscal heath of the organization.
Over the past 40 years, the need to build new stadiums has paralleled increases
in player costs. As the success or failure of a baseball franchise ultimately falls
on the performance of the player on the field, having a revenue stream that permits
the organization to create a competitive club is of paramount importance.
Since stadiums draw fans, which must purchase tickets to see a game in the structure,
building and maintaining a facility that patrons want to pay to enter is almost as
important as the players on the ballclub. But, unlike the other major decisions
discussed here, constructing a new stadium is a long-term effort. In the Basic Level
of Decisions, the steps are reduced to:
A) Switching the "Build a New Stadium?" control to "Yes,"
and then..
B) Selecting an affordable level of political expenditure that sets on the "green
light" toward approval of the right to build the structure.
The Advanced Level of Decisions provides you with a number of choices involving
stadium capacity and financing. Should you wish to avoid altering the choices controlling
stadium capacity, they are pre-set to cause the construction of a 42,000 seat, open-air
downtown stadium with 150 luxury boxes at a cost of approximately $400 million.
All you have to do is determine how you're going to pay for its construction.
You have a number of choices here, split between having the baseball organization
absorb the cost of building the new stadium or placing part of the cost burden on
the public sector.
Placing the cost weight on the public sector exacts a higher political cost in
the simulator. That expense must be countered by spending more money on politics.
The more public monies you request for stadium construction, the larger the amount
of money you must have the organization spend on political issues.
Of course, you may elect to avoid paying these costs, but don't expect to receive
approval to build a new stadium. The reason is associated with public perceptions
of teams that ask for public money for stadiums: taxpayers view players as far wealthier
than they. Therefore the common worker reasons that own stadiums. If the organization
is to be seen as giving its fair share to the community, the public will be less
inclined to think of the firm as selfish and more willing to approve the use of public
money for the stadium.
Obviously, then, the use of revenue toward "poltical" expense does not
imply a payoff of elected officials. Having written that, the intelligent approach
of any baseball executive is to copy the methods commonly used by real estate developers:
campaign contributions to and fund-raisers for the elected officials that will ultimately
approve the new stadium.
Such activities are common and not to be confused with "influnce-peddling"
relationships. Influnce peddling is where the elected official requests that the
developer pay a certain amount of money if they wish to receive a affirmative vote
on the stadium from that politician. It's also where the developer walks in with
a "suitcase full of money" and receives support for the project after the
politician has taken the bribe.
So how is influnce peddling different from campaign contributions? Contributing
to the election fund of a politician is governed by state and federal laws regulating
the size of contribution and the method of declaring it. Such actions can be monitored
by the local newspapers. Influnce peddling is an illegal activity performed beyond
the watchful eye of the press.
Political spending includes far more than monies paid to campaigns. It incorporates
charitable contributions and special community projects, like building ballfields
for public school children.
The more of these activities the general public sees from the baseball organization,
the more certain stadium approval becomes.
Once the political body (city, county, or state, or some combination) gives the
go-ahead for construction of the new baseball structure, the process of actually
building it commences. In the simulator, this takes three years, but in the real
world actual building time varies from as little as two years to as long as four
years or more.
After three years, the stadium will open. The first impact on the baseball organization
will be an immediate dramatic increase in attendance, if the team is performing well.
If it's not, then attendance will spike, but only for the year in which the new
stadium was open, and depending on the perfomance of the team, the number of "star
players," and marketing expenditures it may be high the year after that.
The team will realize greater revenue not just because of the novelty factor associated
with a new stadium, but the increased sources of revenue following to the team.
First, the organization is the primary owner of the stadium in the simulator. Because
of this, its able to retain more of the revenues from different sources than in the
current case. For example, the Baseball share the Network Associates Coliseum with
the Oakland Raiders, and the stadium (arena nearby) are owned by a joint powers authority
representing the City of Oakland and the County of Alameda.
That entity keeps a percentage of revenues from concessions, parking, and stadium
advertising, and what the stadium authority does not retain is to be shared with
the Oakland Raiders. Moreover, the design of the stadium, combined with its multi-tenant
lease structures, prohibit the Baseball from capturing the full cost of reserving
the stadium's entire complement of luxury boxes. The luxury boxes on the East Side
of the structure were built for the Oakland Raiders, who retain the deposits paid
to purchase the boxes. The boxes on the West Side of the structure are also offered
as part of the Raiders Package. The same boxes are sold by the Baseball, but under
a cost structure that does not reflect their true value.
Another example exists in concessions. A newer stadium will have a larger number
of concessions outlets, permitting more patrons to be serviced, and increasing the
percentage of people purchasing food, even with higher prices.
The final example rests in naming rights. The current deal for the
stadium is only at $6 million, one of the lowest in professional sports.
The naming rights deal for a new Oakland Baseball stadium may be as high
as $4 million annually, over a 20 year period (according to estimates
for naming rights potential value published
in Street and Smith's Sports Business Journal) -- $80
million. In a scenario where the baseball team owns the stadium, the
larger percentage of the annual fee would
go to the Baseball, with the remainder to the City of
Oakland (or the joint powers authority, if they were the negotiating
entity for the public sector.
The greater jump in revenue will cause the
organization's franchise value to increase
as well (offset only by the level of debt you've drawn
for the organization).
In closing, developing a business plan that permits timely changes in Ticket Prices,
Marketing Expenditures, and Player Payroll, and with spending for an extensive Scouting
and Player Development program, and a the maintenance of a moderate level of Debt
will cause your simulated Baseball organization to be as successful as the Oakland
Baseball and New York Yankees are in the real world.
SBS Oakland Baseball Simworld Library
If you are developing a class project around the subject of the major league baseball
using this simulator, these links below are recommended SBS resources.
Oakland Baseball Stadium Issue
The Oakland Athletics' need for a new stadium has produced a wealth of information,
while the problem remains unresolved.
1.Oakland
Baseball Fan Coalition Web Site (contains a wealth of information on A's Stadium
Studies).
2. Oakland Athletics Cactus League Stadium Issues (good background
for any student interested in the components of Scouting and Player Development expenditures).
3. Future of Oakland A's may hinge on new stadium (this is an article
on MLB Commissioner Bud Selig's view stated early in 2003)
4.
Will Oakland's dream come true? (an Oakland Chamber of Commerce article)
5.Santa Clara exit puts San Jose in position as next A's site (this
is no longer the case, but the article provides an important understanding of the
competing political interests in the San Francisco / Oakland Bay Area.
Oakland Athletics Existing Stadium Issues
1. Ballparks by Munsey and Suppes Summary of Network Associates Coliseum
2.
Baseball-statisics.com ( a comprehensive, if critical web page on all aspect of Network
Associates Coliseum as it applies to baseball.
Oakland Athletics Ownership and Lease Issues
1.
The Oakland Athleticsl and Major League Baseball (WNUR Sports)
2.
Update on Oakland Athletics Situation (WNUR Sports)
3. Oakland A's extend stadium lease through 2007
4.
Owner says move affirms commitment to Oakland
Oakland Athletics Player and Executive Negotiation Issues
1.
2003:Tejada hoping A's have change of heart
2. 2002:
Beane and Red Sox have deal pending agreement with Oakland
Related MLB Topics
MLB Revenue Sharing
1. 2001 MLB Operating
Revenues and Expenses, with Revenue Sharing
2. MLB Revenue Sharing
Is Main Topic at League Talks
3. Progress Made
On Revenue Sharing
4. Analysis
of MLB Revenue Sharing by Doug Pappas
5.
Baseball Commission Calls for More Revenue Sharing
6.
The Yankees and Revenue Sharing
|